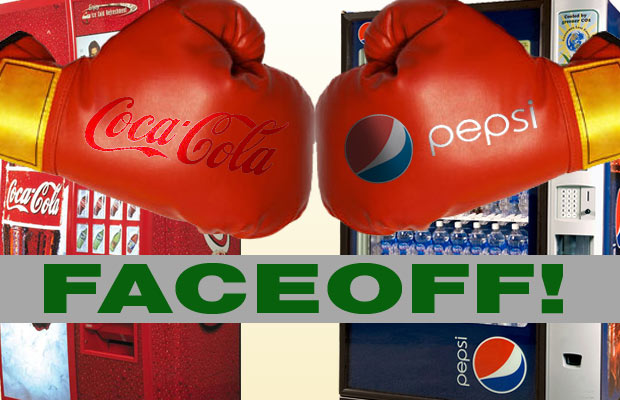
It's easy to have an opinion in the Coke versus Pepsi taste wars, but things get a little murky when corporate sustainability is taken into account. In the new book The HIP Investor, R. Paul Herman attempts to sort out the sustainability claims of Coca Cola Co. and PepsiCo. So who comes out on top?
Coke's most impressive step toward sustainability is its "Commitment 2020" plan, which outlines the company's goals over the next 10 years. These include: a carbon footprint reduction of 15% (from a 2007 baseline), minimizing water use, recovering 100% of packaging, and increasing recycling. Coca-Cola has also pledged to phase out hydrofluorocarbons (HFCs)--potent greenhouse gases used as refrigerants--by 2015. Lisa Manley, the Director of Sustainable Communications at Coca-Cola, explained the company's commitment to using local resources in an interview with Herman: "There are some places we use sugar cane, in Europe there is sugar beet, and there are some places we use corn syrup. We look at what is available in the local market and what is the cost structure."
The company still has a long way to go, however, especially where water is concerned. Coca-Cola used 300 billion liters of water in 2007--just 2% less water than the company used in 2002. The company has, however partnered with the World Wildlife Fund to cut down on water use. And it plans to improve water efficiency by 20% by 2012 compared to a 2004 baseline.
PepsiCo, on the other hand, has committed to cut water use by 20%, slash fuel use by 25%, and cut electricity by 25% by 2015 compared to 2006 levels. And like Coke, the company is committed to removing HFCs from vending machines. PepsiCo has also made strides in food sustainability--the company owns SunChips, which recently unveiled the first 100% compostable chip bag.
But Pepsi isn't perfect. The company has been accused of draining aquifers in areas where water is scarce, and it hasn't exactly made strides in cutting some of the most toxic ingredients from its products--benzoate compounds in soda, for example. Still, we think that the company ultimately trumps Coke for its achievable yet impressive goals.
Check out the full HIP Investor chart below.
| PepsiCo | Coca-Cola Co. | |||
| Overview | Products found in over 200 countries; $43.3 billion revenue, 198,000 employees | Over 3,000 beverage products sold in over 200 countries; $31.9 billion revenue; 92,400 employees | ||
| Product | In 2006, 43% of PepsiCo net revenues in North America came from Smart Spot products, and Smart Spot eligible products represented two-thirds of growth in North America; goal of deriving 50% of all U.S. revenues from Smart Spot eligible products by 2010 | In 2007, Coke launched 450 new beverage products, including 150 low- and no-calorie options, increasing that share of its product portfolio by 17% from 2006 to 2007; to date, its 700+ low- and no-cal products, account for approximately 23% of their 2007 unit case volume | ||
| Management Practices | 20 of 25: Environmental Sustainability Leadership Team and Environmental Council (2007) Established a leadership team to ensure that environmental impacts are considered in the organization | 20 of 25: In 2008, the company started including sustainability as a tool to evaluate business plans and performance | ||
| Health of 20% | Customer satisfaction in 2008 is 84%. Frito-Lay has 28 sites recognized by OSHA for safety; systematic wellness approach for staff, 60%+ participation rate for eligible employees | 8% | Customer satisfaction in 2008 is 85%; 2.3 safety lost-time incident rate; Coke is expanding its nutrition labeling, but slowly | 7% |
| Wealth of 20% | A majority of employees have access to Pepsi’s stock-based compensation program; CEO earned 241-X an average employee’s salary | 14% | Employees may contribute 10% or up to $8,000 to the stock option plan; CEO earned 477-X an average employee’s salary | 10% |
| Earth of 20% | As of 2006, Frito-Lay achieved a GHG reduction of 8.8% from 2002 baseline and reduction of 16.1% from 1999 baseline In 2007, Pepsi reduced its “absolute distribution footprint” (energy) by 4.3% despite shipping 10.3% more products | 11% | 300 billion liters of water used overall in 2007, a 2% decrease since 2002; 2.47 liters of water/liter of product in 2007; 85% compliance with internal water treatment standards in 2007 | 9% |
| Equality of 20% | $1.13B in purchases from minority- and women-owned supplier businesses 7 of 13 Board members are female or ethnic minorities | 17% | $366MM in supplier diversity spending (Increase by 23% from 2006) 4 of 14 Board members are female or ethnic minorities | 16% |
| Trust of 20% | LEED certification in some facilities, internal audits; 26 PepsiCo International facilities are ISO 14001 certified | 12% | Coke’s system has 146 facilities that are OHSAS 18001 certified, including 37 of our Company-owned sites | 12% |
| Human Impact TOTAL, of 100% | Summary: PepsiCo wins in most areas, but it could do more to make its products healthy | 62% | Summary: Coke scores points for sustainability, but it needs to work on Board member diversity | 56% |
| Corporate Profit of 20% | +34.8% return on equity (2008) +3.7% annualized total return, including reinvested dividends (6/2004–6/2009 +3.8% annualized total return, including reinvested dividends (6/2006–6/2009) | +27.5% return on equity (2008) +1.8% annualized total return, including reinvested dividends (6/2004–6/2009) +6.7% annualized total return, including reinvested dividends (6/2006–6/2009) |
|


Share this post with your IBM friends on facebook!
No comments:
Post a Comment